Software
To investigate the physiology of meditation, I developed programs to help extract information from the recordings of respiration, heart rhythms and brainwaves and to display data in tables, charts and graphs. The first was a Cardiorespiratory Viewer program that I wrote as part of my final project in an online neuroscience course. More recently, I have been developing a Physiology Viewer program that supports EEG recordings from the Muse Headband while maintaining some of the functionality of the Cardiorespiratory Viewer.
Note: Source Code Availability
Source code for the Physiology Viewer and associated accessory programs are now available at,
https://github.com/davidtro/physiology-viewer/
Cardiorespiratory Viewer
The Respiratory Viewer opens a text file of data collected by the Vernier ECG sensor and Respiration Monitor and displays graphs of heart and breath rhythms. The top graph shows the heart signal in millivolts. The lower graph shows the pressure readings of the respiration monitor in kilopascals. The program makes use of an algorithm for finding spikes (the R-wave in the ECG signal and the maximum pressure in the breath signal) and plots these as red and blue tick marks respectively above the graphs. Sliders below the graphs are used to select a time interval of interest and sliders to the right are used to select threshold values for voltage and pressure levels. The threshold levels should be set to capture each cycle once and only once.
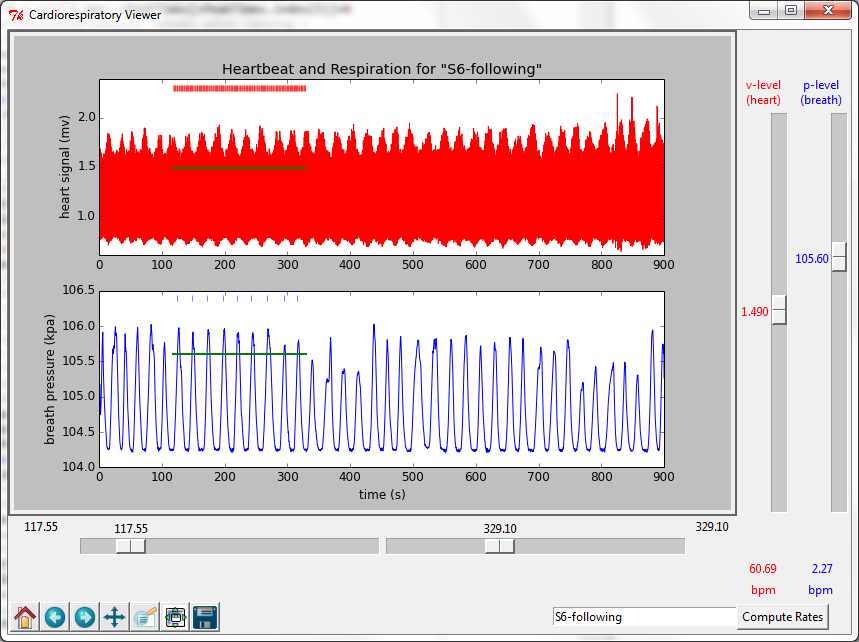
Program for displaying and analyzing ECG and respiration signals
Using the icons in the lower left hand corner, the user can zoom in to different parts of the graph for a closer look. See, for example the posting “Heartbeat and respiration during meditation.”
Clicking on the Compute Rates results in a display of heart rate (beats per minute) and breathing rate (breaths per minute). See, for example “Respiration and heart rate during meditation and reading.”
Cardiorespiratory Viewer Version 2
With a few small changes, the Cardiorespiratory Viewer gained new functionality: the ability to display an average waveform for a selected range of cycles in heart heart or breath rhythms. Version 2 of the program was equipped with two additional buttons, v-wave and p-wave.
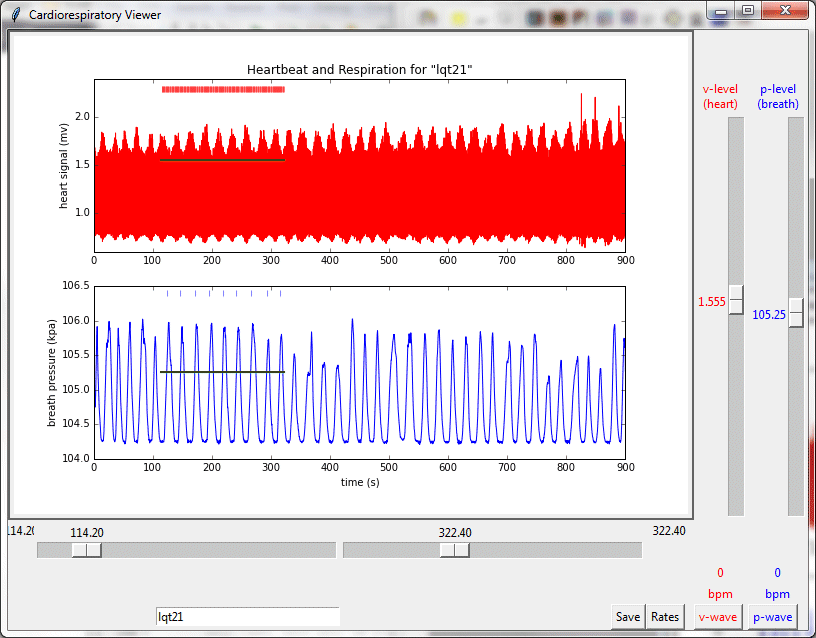
Version 2 of Cardiorespiratory Viewer program
After selected a time interval over which to average, clicking on these buttons produces the following result:
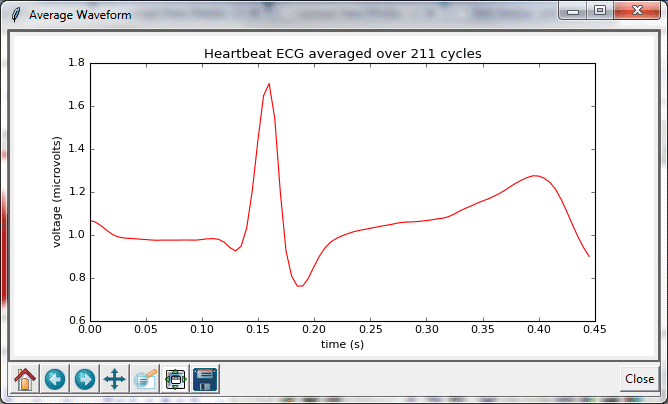
ECG waveform averaged over 211 heartbeats
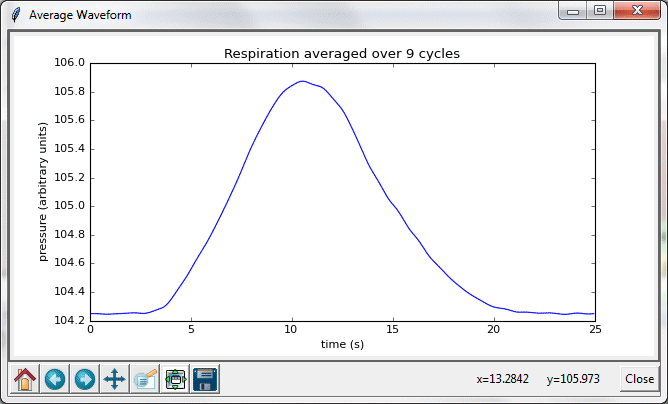
Respiration cycle, averaged over 9 breaths.
In the research literature on Zen meditation, there are papers reporting increased heart rate variability (HRV) among meditators. I am considering adding functionality to the Viewer program to include estimates of HRV (an indication of how much the time varies from one heartbeat to the next).
Physiology Viewer
[Note: The Physiology Viewer has been upgraded to version 2.0. See Introducing Physiology Viewer 2.0]
The Physiology Viewer opens data files corresponding to each recorded session (data from the Muse Headband, or from the Vernier the respiration monitor or ECG sensor). It also opens an Excel spreadsheet containing additional information about each session: date and time, subject name, recording name and description, etc. The spreadsheet also has columns that can represent named time intervals within the session corresponding to different segments, such as “counting breath,” “mind wandering,” “thinking about tools” or other arbitrary conditions. The Viewer can save these segments and display corresponding graphs for each.
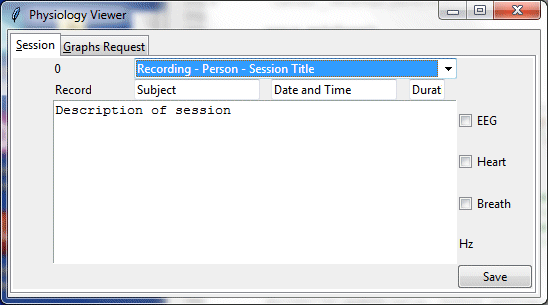
Physiology Viewer program, before a session has been selected.
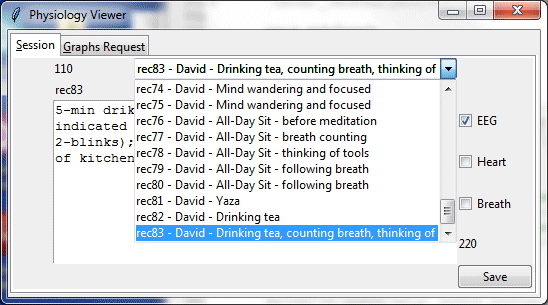
Dropdown list for selecting session.
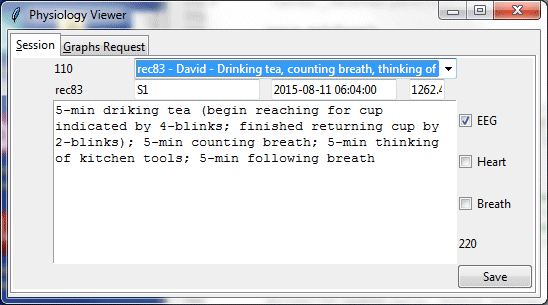
Description of selected session.
The Graphs Request tab is used to select a graph type and a time segment within the session to view. Initially there would not be any segments specified other than “entire session.”
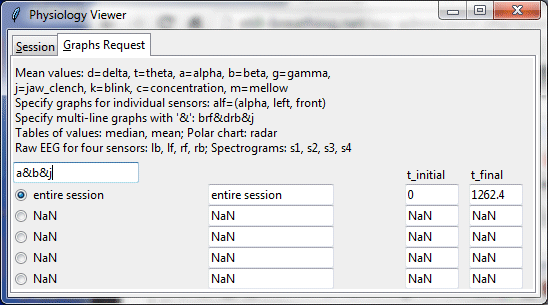
The command “a&b&j” indicates a request for a graph displaying mean of alpha and beta values for four sensors plus a jaw clench signal which was used by the subject to specify the beginning and end of segments. “NaN (not a number) indicates that no value has been specified yet.
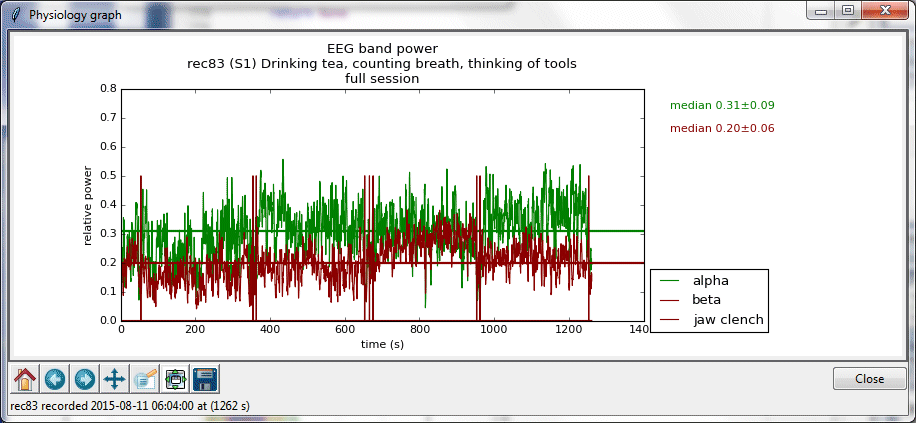
Graph of mean alpha and beta relative power, along with jaw clench signals at the beginning and end of desired segments.

Zoomed in view of graph, obtained by clicking on 5th icon in the lower left and indicating a region containing initial and final jaw clenches.

Segment names, such as “drinking tea – 1” have been entered, along with initial and final times (56.0 and 353.0) by reviewing zoomed in graph above. A graph type is selected by entering a command such as “drf&b” for delta right front and mean beta.

Graph of relative power for delta band at the right front sensor and mean beta during segment “drinking tea”
Other graphs and charts can be selected by entering other commands. The following chart, called a radar chart shows relative power values of delta, theta, alpha, beta and gamma bands at each of the four sensors left back, left front, right front and right back.

A radar chart for the segment “thinking of tools”
A radar chart is a polar graph in which the radial distance from the center corresponds to the dependent variable (here, relative band power) and the angle around the circle to the independent variable (here, the sensor positions lb, lf, rf and rb). Roughly, these positions correspond to the sites on the scalp (TP9, FP1, FP2, TP10) used in the 1020 system (looking down on the head, nose at the top). The Muse has a reference electrode located in the center of the forehead, directly between FP1 and FP1.

International 10-20 EEG system.
The data displayed in the radar chart above shows values for five different bandwidths measured at four different sensor locations (lb, lf, rf, rb) relative to the reference electrode. The same date could also be displayed in a simple bar graph, as below.

Alternate way to display the same data as in radar chart.
However, the radar chart has the advantage over the bar graph of showing the general area of the head at which the sensors were located.
Other display options include spectrograms, raw EEG time series and tables of values.
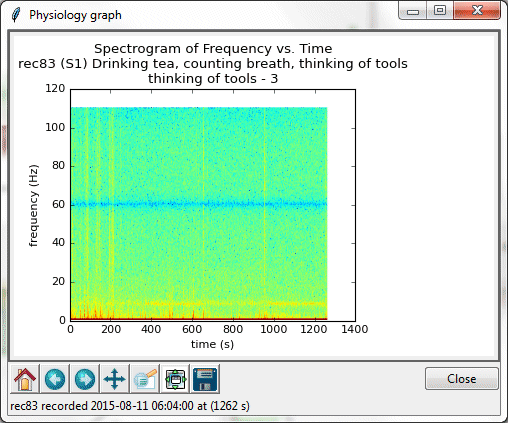
A spectrogram of frequency vs. time for the segment “thinking of tools.” The blue band at 60 Hz is due to interference from 60-cycle AC power sources.

Raw EEG signal in microvolts for samples collected during “think of tools” segment.
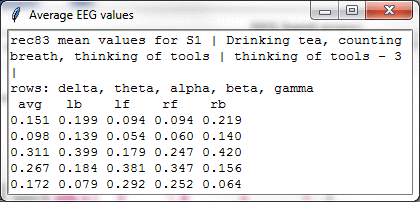
Tables of mean and individual sensor values for five frequency bands
The last option is useful for specialized applications such as when copying and pasting into an Excel spreadsheet.
Next page: Breath and Heart
Hey David,
Excellent work. Really! I just read through your whole ‘Investigation Blog’ just now. Interesting and some enlightening information!
I came across your work because I too have a Muse headband and doing the same training with meditation and wanted to quantify various states of brain activity.
I was just wondering if your software is open source and available anywhere? The Physiology Viewer would be extremely helpful (for Muse headband) to view and extract meaning from my sessions. I’m sure people in the muse community such as my self would be willing to add to the project as well.
Let me know.
Thank you. And keep up the great work!
– Ash
Ash,
Thanks for your inquiry. Yes, this software is open source. I have uploaded it to GitHub at,
https://github.com/davidtro/physiology-viewer/
I hope you find it useful. Please let me know if you have any questions about how to install or use it.
David
Thank you so much for sharing this Dawid program; I tried to follow all your instructions but since launching the program comes out this error:
import numpy as np
ImportError: No module named ‘numpy’
It ‘the first time that Phyton use and do not understand where I’m wrong
thanks in advance if you can help me
Luca
Hi Luca,
Numpy is part of the Scientific Python distribution. See http://scipy.org/install.html for steps on how to install it.
Good luck!
David
Hi David, as A Muse owner and also someone keen to try and quantify my meditative experience, discovering your information here is super exciting. I’d love to help or collaborate if that is of any interest.
Kind regards David
David,
I am embarrassed to say that I didn’t see your comment for over a year (!) Sorry for the late reply. I would be interested to know just how you have made use of your Muse. Do you use it on a regular basis?
David
Hi David, thank you for your wonderful articles in this website!
Is there any executable file available for Physiology Viewer?
Thank you very much…
Agung,
Not yet, but thank you for the suggestion. It looks like it should be possible and it would make it easier to use.
David
Hello David,
Thanks a lot for sharing this very useful python project. I have downloaded the source file from github however, I am unable to run the project as it gives the following error :
sessions_list = [str(sessions_df[‘recording’][i]) + ‘ – ‘ + \
str(sessions_df[‘date_time’][i]) + ‘ – ‘ + \
str(sessions_df[‘person’][i]) + ‘ – ‘ + \
str(sessions_df[‘title’][i])
for i in range(len (str(sessions_df)))]
name “session_df” is not defined.
Would be much appreciated if you can help me in this regard.
Hello Amir,
The error you reported (I think you meant ‘name “sessions_df” is not defined’) will occur if the program cannot find the Excel file EEG_CardioRespSessions.xls in the directory C:\MedRec. Use the example file in the github project and be sure it is in that particular folder.
I apologize that the program is so picky about where accessory files need to be located. It’s not very ‘user-friendly” in that respect.
If you can confirm that you have put EEG_CardioRespSessions.xls in C:\MedRec and still see an error, please let me know.
Thank you and good luck!
David
I know that supporting software can be quite troublesome. So I would fully understand if you can’t reply.
I’m willing to try to work through the errors I’m receiving if you are willing to have a little back-and-fourth, and again I understand if that is not possible.
I have Python installed along with Anaconda. I’ve gotten though the library/module errors, and now I’m into code issues. I’ve tried to run the script from the windows command line and from with Spyder, but both end in errors of undefined what-evers.
I don’t want to get into the specifics if it is no longer possible/desirable for you to work through the errors. I have a technical background, but know nothing about Python, otherwise I probably could figure out what the errors are referring to.
This certainly is not a pressing matter, but I like what you’ve done especially in the blog where you are talking about objective metrics on what is essentially very esoteric and leading edge understanding of what goes on in that 3lbs of grey matter.
And yes, I did move the stated items to the C: location as you’ve specified.
Jim,
First, let me apologize for the 18-month delay in responding to your inquiry. I had left my meditation research to return to amateur astronomy, but just now I saw your message as I am contemplating moving the site to another hosting company. Are you still interested in pursuing this? If so, I am open to some back-and-forth, though it’s been over six years since I was actively living with the code. Let me know.
David